


By Adam McCann
Black Friday shopping is one of America’s most treasured holiday traditions, but there’s always a bit of hassle involved. Traditionally, shoppers have to get up early, stand in endless lines at stores and try to find deals through hordes of other shoppers — all in the name of savings. In 2021, though, Americans shopped from home on Black Friday more than they did in stores, with 66.5 million people getting their deals in person and 88 million making purchases online.
Black Friday sales have also been changing during the past few years. They are starting earlier, weeks ahead of the actual shopping holiday at some stores. That’s good news for consumers who want to stretch out their purchases over a longer period of time rather than buying everything in one day. So which stores offer the best discounts and for which items?
To answer that question and help consumers maximize their Black Friday savings, WalletHub surveyed nearly 4,000 deals from 16 of the biggest U.S. retailers’ 2022 Black Friday ad scans. Below, we’ve listed the stores offering the largest advertised discounts in various product categories such as “Jewelry” and “Appliances.”
Best Places to Shop On Black Friday
| Retailer | 2022 Avg. % Discount by Retailer | 2021 Avg. % Discount by Retailer | 2020 Avg. % Discount by Retailer | 2019 Avg. % Discount by Retailer | 2018 Avg. % Discount by Retailer | 2017 Avg. % Discount by Retailer | 2016 Avg. % Discount by Retailer | 2015 Avg. % Discount by Retailer |
|---|---|---|---|---|---|---|---|---|
| JCPenney | 64.7% | 57.6% | 56.7% | 61.0% | 65.1% | 66.3% | 62.8% | 68.0% |
| Belk | 64.2% | 56.7% | 50.0% | 66.9% | 68.9% | 62.8% | N/A | 59.5% |
| Macy’s | 53.0% | 58.5% | 56.0% | 46.1% | 48.7% | 45.6% | 63.4% | 56.0% |
| Office Depot and OfficeMax | 49.9% | 42.8% | 33.3% | 36.6% | 42.6% | 34.5% | 43.0% | 42.8% |
| Kohl’s | 44.2% | 49.3% | 51.9% | 57.1% | 60.8% | 66.3% | 58.1% | 66.7% |
| Lenovo | 40.7% | 40.3% | 44.1% | 38.6% | 40.1% | N/A | N/A | N/A |
| Target | 32.9% | 22.7% | 28.1% | 34.3% | 34.8% | 36.2% | 28.6% | 37.3% |
| Big Lots | 32.9% | 29.2% | 20.0% | 27.9% | 22.9% | 24.1% | 23.5% | 27.1% |
| Academy Sports + Outdoors | 31.1% | 26.3% | 31.5% | 31.8% | 28.0% | N/A | N/A | N/A |
| The Home Depot | 30.9% | N/A | 32.1% | N/A | N/A | N/A | N/A | N/A |
| Newegg | 28.5% | 20.0% | 23.8% | N/A | 28.4% | 28.3% | N/A | N/A |
| Walmart | 28.4% | 31.6% | 27.8% | 34.3% | 29.9% | 34.2% | 32.6% | 30.1% |
| BJ’s | 27.6% | 26.1% | N/A | 39.3% | 31.0% | 32.1% | 32.0% | 30.6% |
| Amazon | 25.7% | 27.5% | 26.5% | 25.4% | 29.3% | 36.8% | 24.7% | 25.8% |
| Best Buy | 22.9% | 22.3% | 25.3% | 29.5% | 28.7% | 30.0% | 33.2% | 33.5% |
| Costco | 16.8% | 20.5% | 22.0% | 21.3% | 25.1% | 21.9% | 25.4% | 19.5% |
| Overall Average | 37.2% | 32.1% | 32.1% | 40.4% | 37.0% | 37.1% | 39.0% | 40.2% |
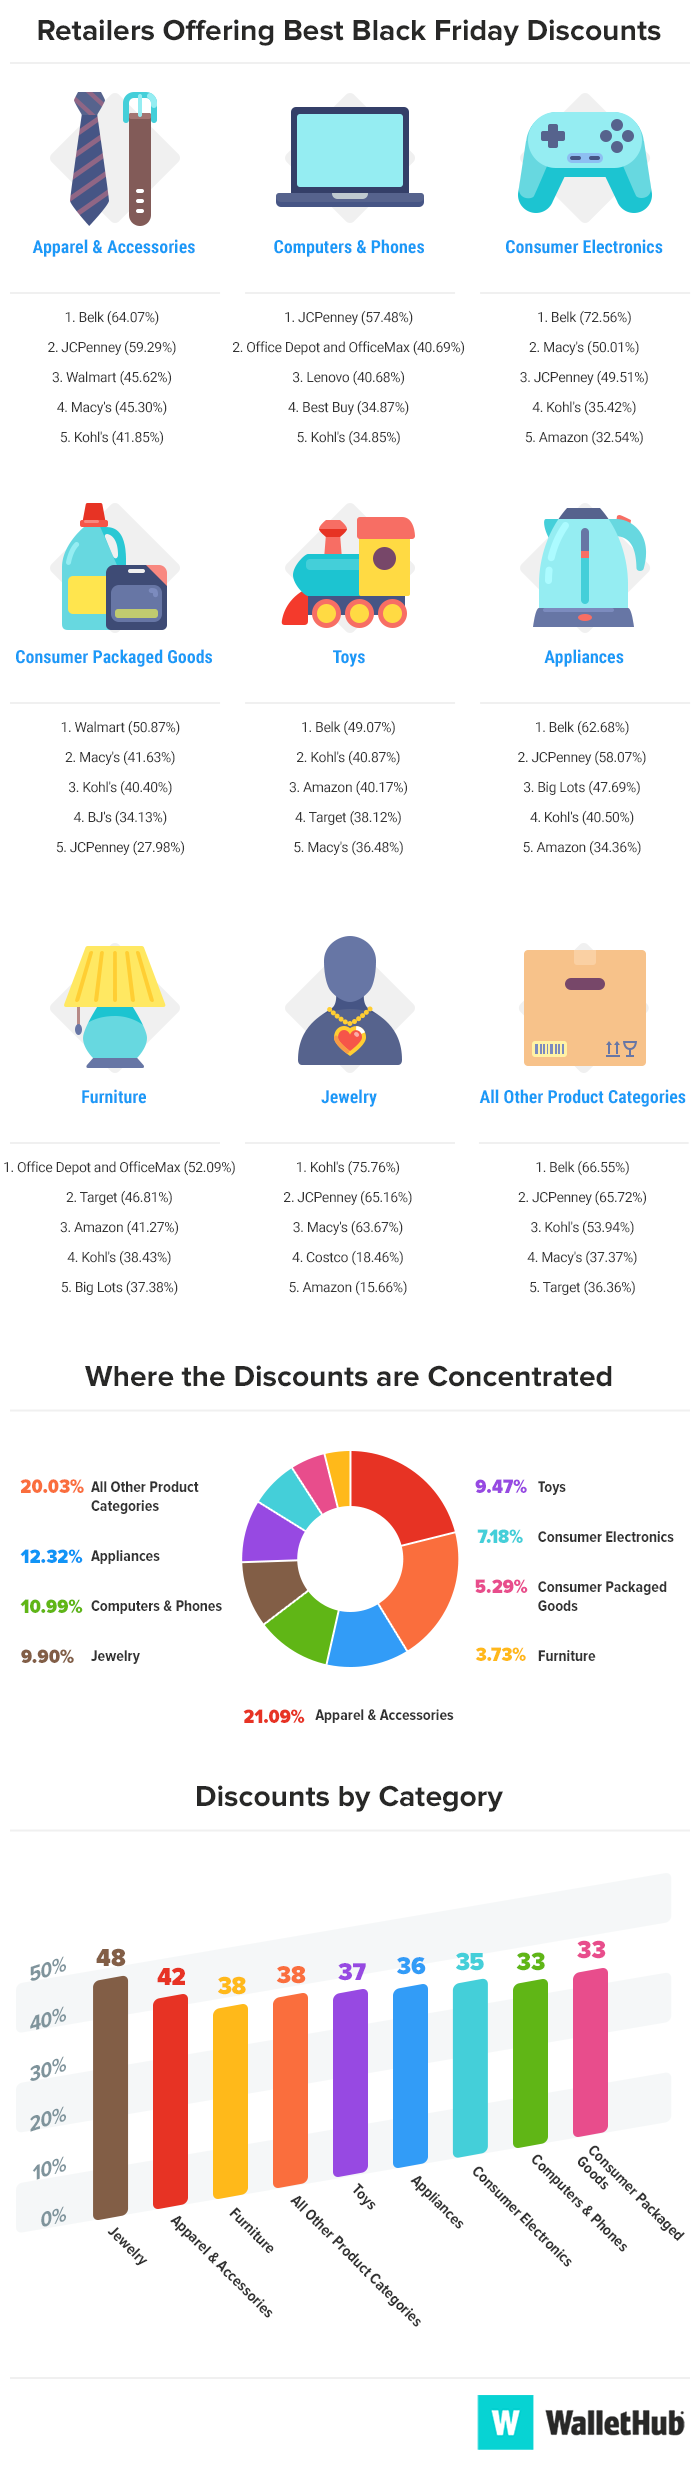 Average Store Discounts by Product Category
| Retailer | Apparel & Accessories | Computers & Phones | Consumer Electronics | Consumer Packaged Goods | Toys |
|---|---|---|---|---|---|
| Academy Sports + Outdoors | 31.37% | N/A | N/A | N/A | 30.86% |
| Amazon | 36.44% | 25.22% | 32.54% | 20.22% | 40.17% |
| Belk | 64.07% | N/A | 72.56% | N/A | 49.07% |
| Best Buy | N/A | 34.87% | 21.07% | N/A | N/A |
| Big Lots | N/A | N/A | N/A | N/A | N/A |
| BJ’s | 19.77% | 26.35% | 23.48% | 34.13% | 34.15% |
| Costco | N/A | 18.93% | 8.96% | 18.57% | N/A |
| JCPenney | 59.29% | 57.48% | 49.51% | 27.98% | N/A |
| Kohl’s | 41.85% | 34.85% | 35.42% | 40.40% | 40.87% |
| Lenovo | N/A | 40.68% | N/A | N/A | N/A |
| Macy’s | 45.30% | N/A | 50.01% | 41.63% | 36.48% |
| Newegg | N/A | 28.40% | N/A | N/A | N/A |
| Office Depot and OfficeMax | N/A | 40.69% | N/A | N/A | N/A |
| Target | N/A | 34.83% | 27.80% | N/A | 38.12% |
| The Home Depot | 33.04% | N/A | N/A | N/A | N/A |
| Walmart | 45.62% | 26.18% | 26.81% | 50.87% | 25.28% |
| Overall Average | 41.86% | 33.50% | 34.82% | 33.40% | 36.87% |
| Retailer | Appliances | Furniture | Jewelry | All Other Product Categories |
|---|---|---|---|---|
| Academy Sports + Outdoors | 23.30% | N/A | N/A | 34.31% |
| Amazon | 34.36% | 41.27% | 15.66% | 33.05% |
| Belk | 62.68% | N/A | N/A | 66.55% |
| Best Buy | 30.36% | N/A | N/A | 22.72% |
| Big Lots | 47.69% | 37.38% | N/A | 31.58% |
| BJ’s | 24.72% | 34.44% | N/A | 26.92% |
| Costco | 28.53% | 19.41% | 18.46% | 15.36% |
| JCPenney | 58.07% | N/A | 65.16% | 65.72% |
| Kohl’s | 40.50% | 38.43% | 75.76% | 53.94% |
| Lenovo | N/A | N/A | N/A | N/A |
| Macy’s | 24.70% | N/A | 63.67% | 37.37% |
| Newegg | N/A | N/A | N/A | N/A |
| Office Depot and OfficeMax | N/A | 52.09% | N/A | N/A |
| Target | 27.57% | 46.81% | N/A | 36.36% |
| The Home Depot | 29.27% | 32.97% | N/A | 35.42% |
| Walmart | 34.13% | N/A | N/A | 29.72% |
| Overall Average | 35.84% | 37.85% | 47.74% | 37.62% |