


By. David Heacock
The year 2020 marked another decennial Census, the once-a-decade federal project of counting the U.S. population. The Census collects data on a variety of demographic indicators, giving the federal government and the public alike more information on how the population has changed and what that means for the future. One of the most impactful demographic trends across the United States in the coming decades will be the growth in the population aged 65 and older.
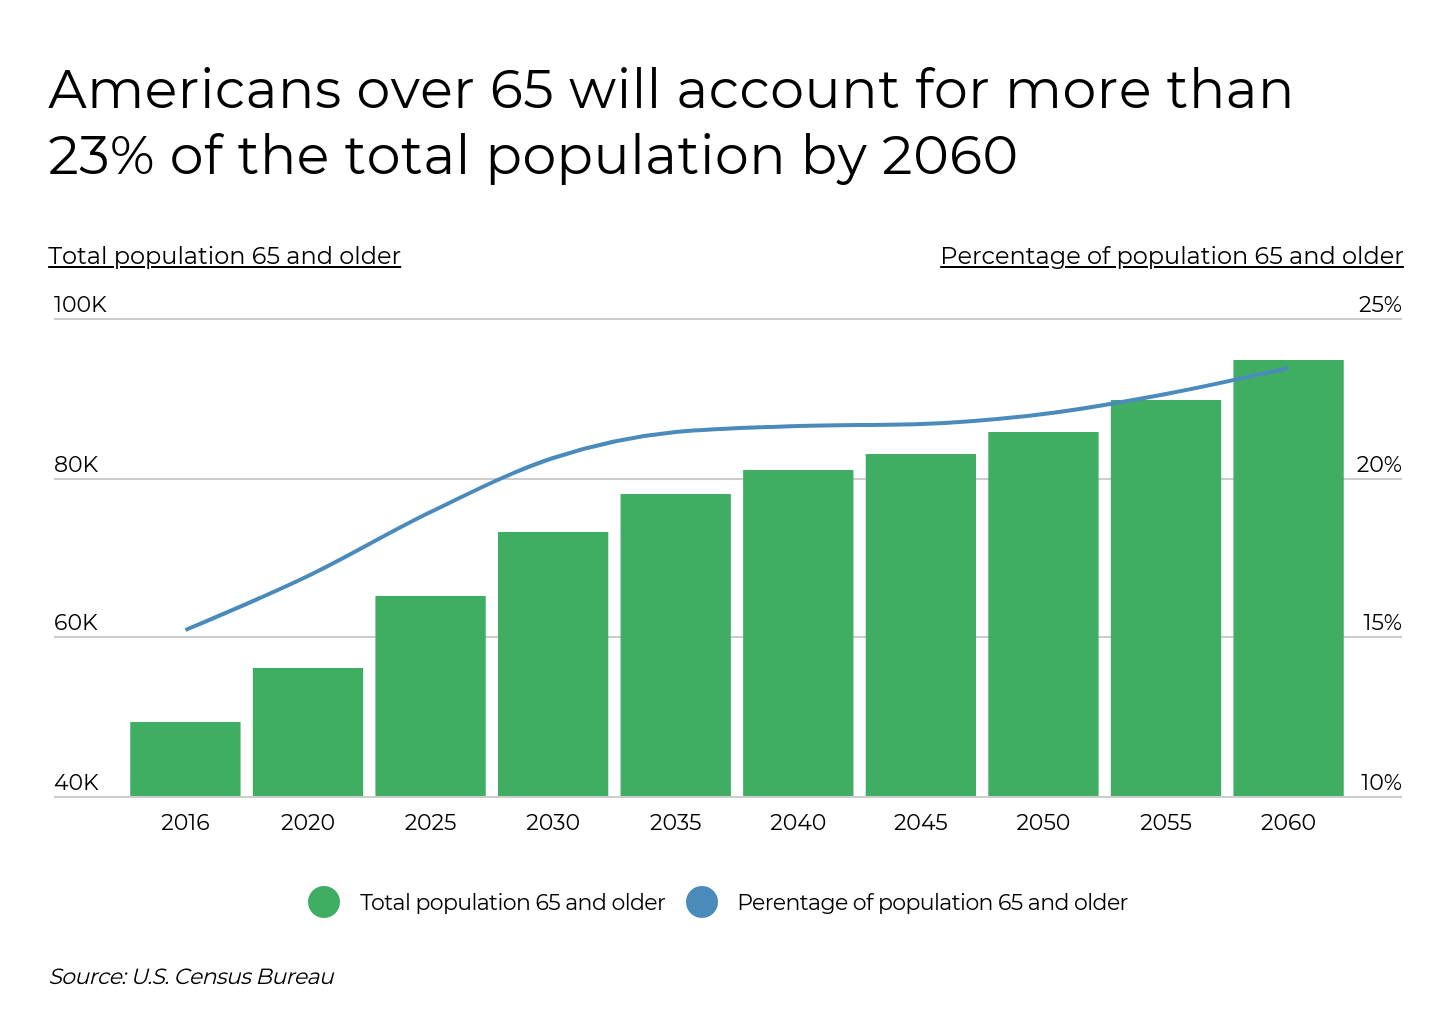
Much of the country is graying as more Baby Boomers, who were until 2019 the U.S.’s largest generational cohort, reach retirement age. The Boomers—more than 73 million Americans born between 1946 and 1964—began hitting retirement age more than a decade ago and will continue to age into the 65-and-up bracket until the end of the 2020s. Thanks to advances in healthcare and medicine, these older Americans are projected to live longer on average than their predecessors. According to the Census Bureau, by 2030, those aged 65 and older will constitute more than 20 percent of the U.S. population, and they are projected to remain between one-fifth and one-quarter of the U.S. population through at least 2060.
The year 2020 marked another decennial Census, the once-a-decade federal project of counting the U.S. population. The Census collects data on a variety of demographic indicators, giving the federal government and the public alike more information on how the population has changed and what that means for the future.
One of the most impactful demographic trends across the United States in the coming decades will be the growth in the population aged 65 and older.
Much of the country is graying as more Baby Boomers, who were until 2019 the U.S.’s largest generational cohort, reach retirement age. The Boomers—more than 73 million Americans born between 1946 and 1964—began hitting retirement age more than a decade ago and will continue to age into the 65-and-up bracket until the end of the 2020s. Thanks to advances in healthcare and medicine, these older Americans are projected to live longer on average than their predecessors. According to the Census Bureau, by 2030, those aged 65 and older will constitute more than 20 percent of the U.S. population, and they are projected to remain between one-fifth and one-quarter of the U.S. population through at least 2060.
TRENDING
It’s a healthy habit to replace your home air filters regularly. If you’re older or suffer from a respiratory condition, you should consider purchasing MERV 13 air filters, which provide the best protection inside your home.
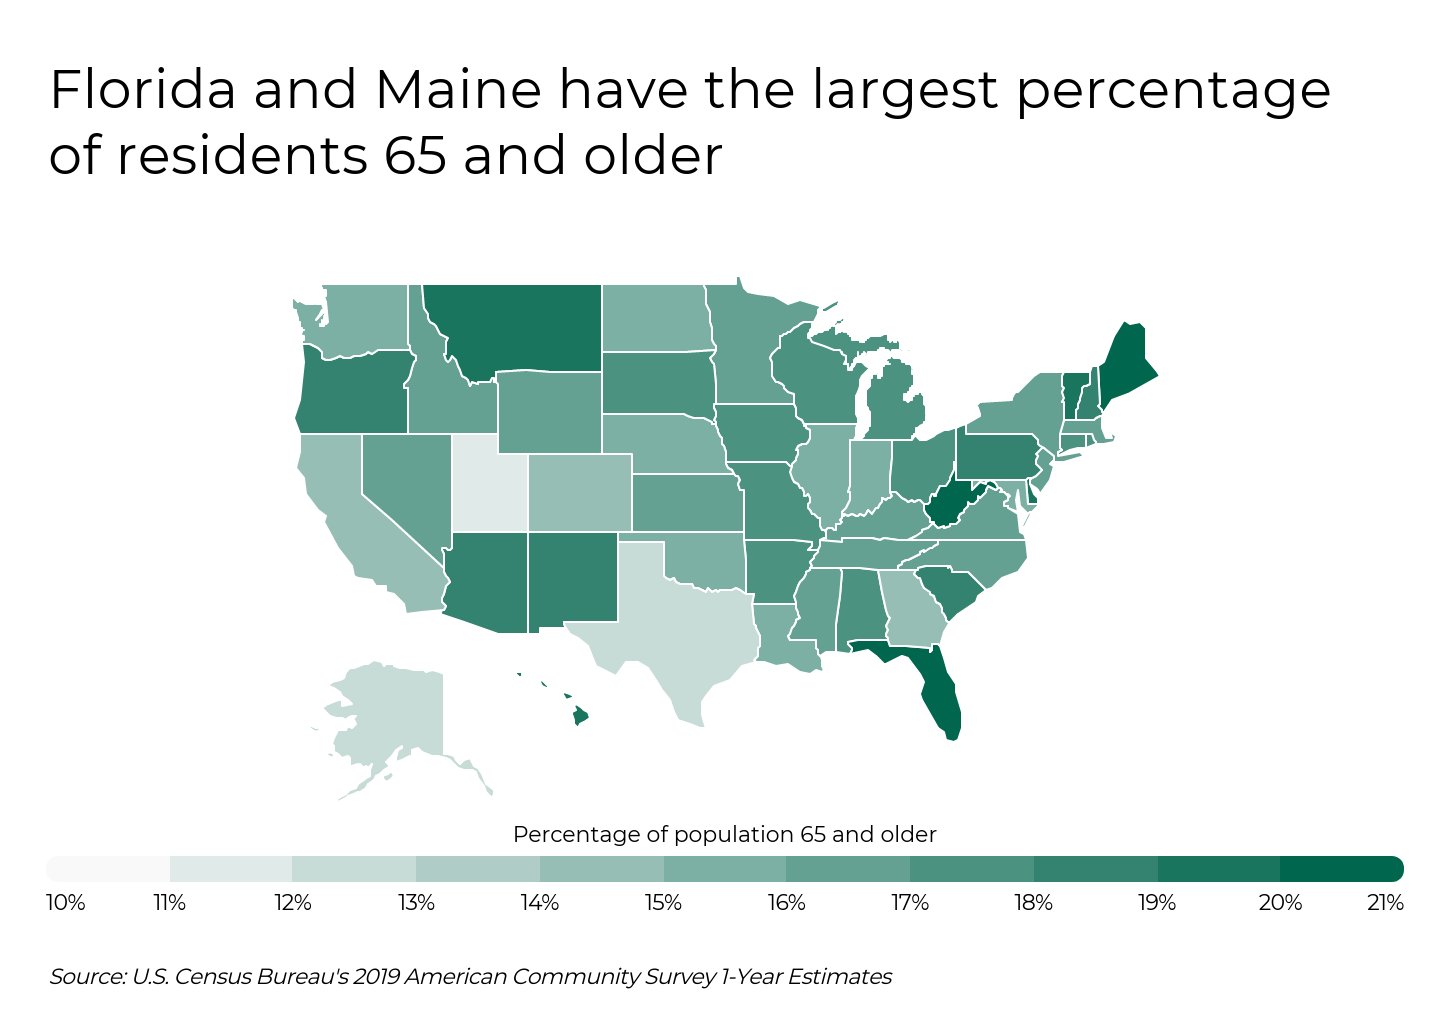
Contrary to what one might expect, it won’t just be retirement destinations like Florida—the state with the highest share of seniors currently—who will feel the effects of an aging population. The population over 65 is growing across the country, and other states leading the list of senior populations are as geographically and culturally varied as Maine, West Virginia, Hawaii, Pennsylvania, and South Carolina.
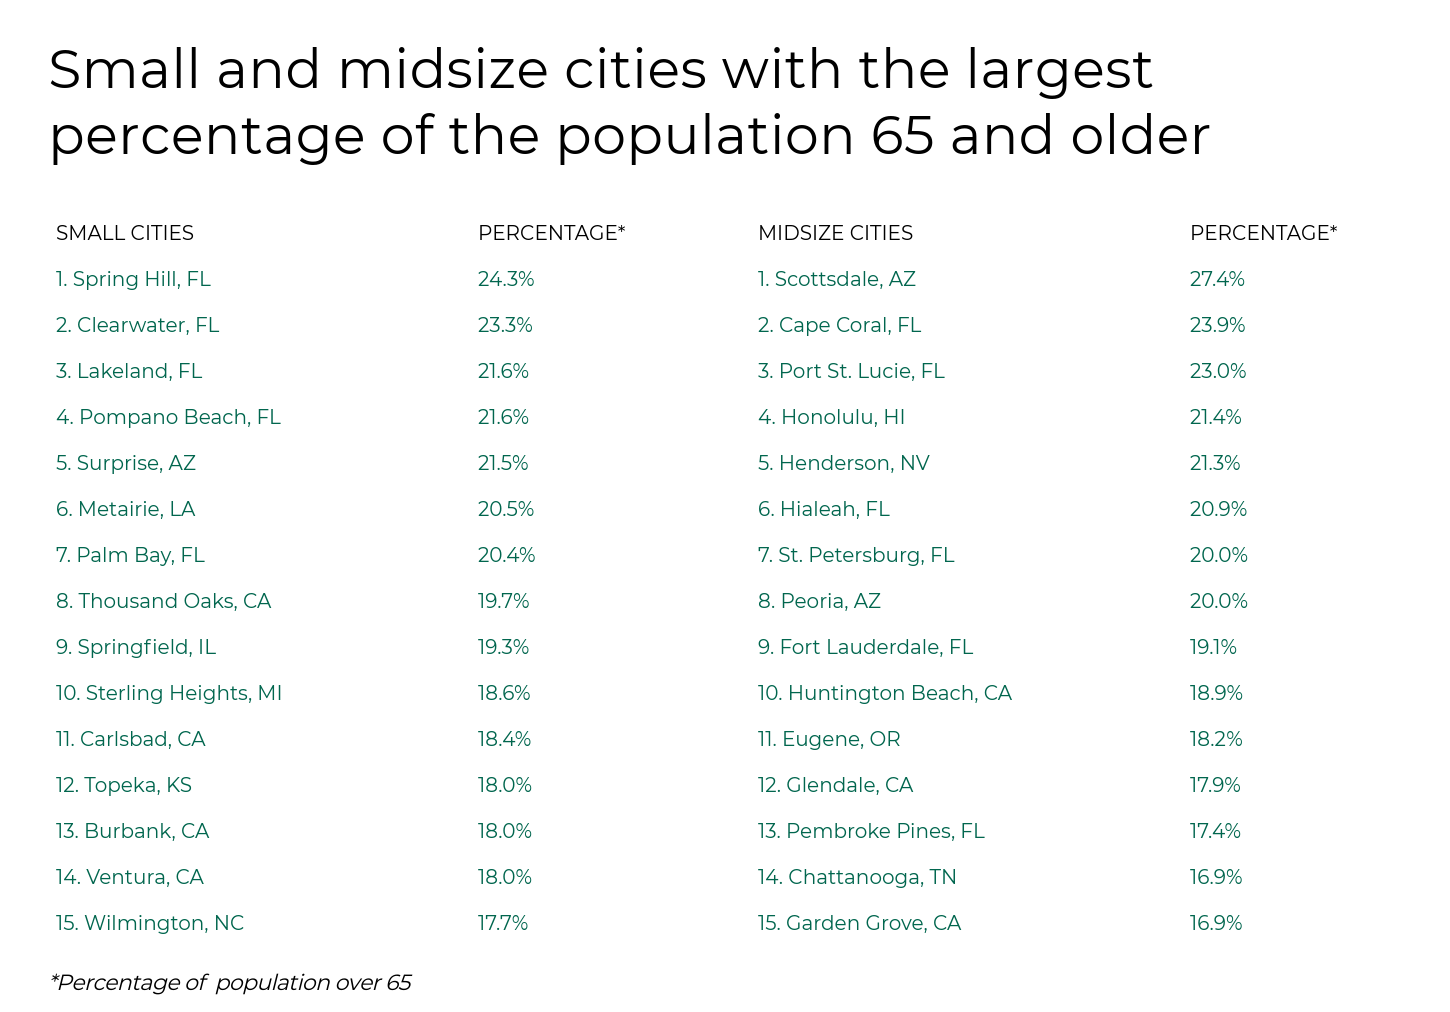
The same conditions are true of cities, and they will likewise experience the impacts of an aging population. To find the cities where these trends will be most apparent, researchers at Filterbuy used 2019 U.S. Census data to identify which metro areas have the largest share of residents over 65. The researchers also found the city-level old-age dependency ratios as well as the percentage of the senior population with a disability to understand where the burdens of care may be even higher.
Here are the cities with the largest percentage of the population 65 and older
Large Cities With the Oldest Populations
Jacksonville, FL
Percentage of population 65 and older: 14.4%
Total population 65 and older: 127,758
Percentage of population 65 and older with a disability: 35.9%
Old-age dependency ratio: 22.8%
Baltimore, MD
Percentage of population 65 and older: 14.4%
Total population 65 and older: 84,165
Percentage of population 65 and older with a disability: 38.5%
Old-age dependency ratio: 22.3%
Tulsa, OK
Percentage of population 65 and older: 14.7%
Total population 65 and older: 58,686
Percentage of population 65 and older with a disability: 33.4%
Old-age dependency ratio: 24.8%
Las Vegas, NV
Percentage of population 65 and older: 14.8%
Total population 65 and older: 95,394
Percentage of population 65 and older with a disability: 34.9%
Old-age dependency ratio: 24.4%
New York, NY
Percentage of population 65 and older: 15.0%
Total population 65 and older: 1,242,566
Percentage of population 65 and older with a disability: 34.6%
Old-age dependency ratio: 24.0%
Colorado Springs, CO
Percentage of population 65 and older: 15.1%
Total population 65 and older: 70,512
Percentage of population 65 and older with a disability: 31.3%
Old-age dependency ratio: 23.6%
New Orleans, LA
Percentage of population 65 and older: 15.3%
Total population 65 and older: 59,203
Percentage of population 65 and older with a disability: 35.9%
Old-age dependency ratio: 24.0%
Virginia Beach, VA
Percentage of population 65 and older: 15.4%
Total population 65 and older: 65,405
Percentage of population 65 and older with a disability: 31.2%
Old-age dependency ratio: 23.3%
Tucson, AZ
Percentage of population 65 and older: 15.5%
Total population 65 and older: 82,197
Percentage of population 65 and older with a disability: 38.8%
Old-age dependency ratio: 23.7%
Louisville, KY
Percentage of population 65 and older: 15.6%
Total population 65 and older: 95,530
Percentage of population 65 and older with a disability: 34.8%
Old-age dependency ratio: 25.5%
San Francisco, CA
Percentage of population 65 and older: 15.9%
Total population 65 and older: 139,273
Percentage of population 65 and older with a disability: 34.2%
Old-age dependency ratio: 22.7%
Albuquerque, NM
Percentage of population 65 and older: 16.2%
Total population 65 and older: 90,429
Percentage of population 65 and older with a disability: 33.4%
Old-age dependency ratio: 26.5%
Mesa, AZ
Percentage of population 65 and older: 16.5%
Total population 65 and older: 85,337
Percentage of population 65 and older with a disability: 31.9%
Old-age dependency ratio: 28.5%
Miami, FL
Percentage of population 65 and older: 17.5%
Total population 65 and older: 81,251
Percentage of population 65 and older with a disability: 34.6%
Old-age dependency ratio: 27.1%